

I have been using Matplotlib to visualize data for more than a year. It is awesome and handy.
However, when I learned the Dive into Deep Learning course and tried to add bounding boxes to a picture, the xy paramter of the Rectangle class confused me.
According to the Matplotlib API reference, the Rectangle constructor’s parameters are (xy, width, height, angle=0.0, **kwargs), where xy is the bottom and left rectangle coordinates. This is exactly right for data plotting (plt.plot and the likes), but wrong for image display (plt.imshow). I will demonstrate the confusing, undocumented difference.
For image display, my code is:
import numpy as np
import matplotlib.pyplot as plt
from mxnet import image
img = image.imread("./data/dog.jpg").asnumpy()
fig, axes = plt.subplots(1, 1)
axes.imshow(img)
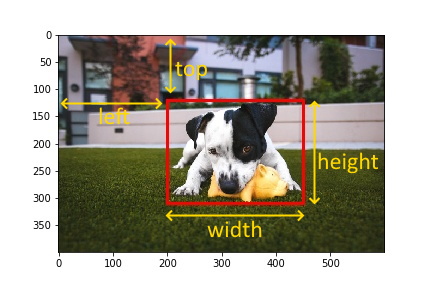
axes.add_patch(plt.Rectangle(xy=(200, 120), width=250, height=190,
fill=False, edgecolor='red', linewidth=3))
plt.savefig("./data/dog_boxed.jpg")
And the resultant image is:
For data plotting, my code is:
x = np.linspace(0.0, 600.0, 1000)
y = 0.65 * x + 10.0

fig, axes = plt.subplots(1, 1)
axes.plot(x, y)
axes.add_patch(plt.Rectangle(xy=(100, 200), width=250, height=120,
                fill=False, edgecolor='red', linewidth=3))
plt.savefig("./data/linear_boxed.png")
And the resultant image is:

The arrows and text on the two images are added by hand.
The problem is caused by the direction of the vertical axis. For data plotting, it comes from bottom to top. For image display, however, it comes from top to bottom. The API reference documents the first case, but says nothing about the second case.
In my opinion, the y in xy means the starting point of the vertical axis. Ditto for x. This understanding should be more clear for those who need to handle both data plotting and image display.
To address this confusion, I have added an issue on the Matplotlib’s github repository.
Note: The cute dog photo is shared by Justin Veenema on unsplash.com.